I love stats and graphs. I dont know why, I just do :P So when I looked up to find the count of posts I did this year, I realized that there was a lot of info that made good stats. Here are some of the stats from my blog :)
We start of first comparing the last 4 years of my blogging. 2008 has been by far the most consistent year for me. Only in march did the number of posts reach a low, then again that month I was traveling for 2 whole weeks!
Towards the end of the year my blogging frequency consistently increased. Interestingly I was using twitter and friend feed in the last few months as well.
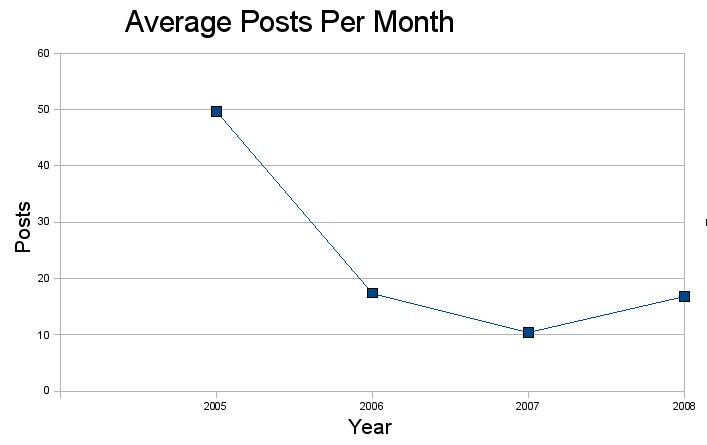
The figure that stands out in the above graph is my blogging spree in 2005. I had written 76 posts in Sep 05 and 63 posts in Oct 05, Combined that was more posts in those two months than all of 2007 combined!
2005 is still the most blogged year of my life, despite the fact that I was actively blogging only about 5 months! 2008 only just edged out 2006 as the second placed year, by a measly 2 posts!
So a more accurate figure would be generated by comparing the posts per month of each of the years. Not a surprise that 2005 is on top again, but check out the margin.
There were close to 2 posts for each blogging day in 2005! 2008 was much closer to my resolution mark of 2 posts every 3 days.


